
This application note is supposed to be the first in a series dealing with the electrochemical testing of materials for lithium-ion batteries (LiB) using the PAT system from EL-CELL. More precisely, we will show you the advantages of the PAT-Cell (compared to other test cells like button, Swagelok and pouch cells) and the PAT battery testers (compared to other high-end battery cyclers, impedance analyzers and electrochemical workstations).
For that purpose, we are going to look into typical test cases from the battery lab: full cells made up of NCM and graphite as the two electrodes, or so-called half cells comprised of either NCM or graphite as one electrode, and lithium metal as the second electrode, or the like.
Part of the mission is to convince you that a reference electrode is indispensable, and so we will perform all tests with a reference electrode as the third electrode.
—
Which electrodes should we start with?
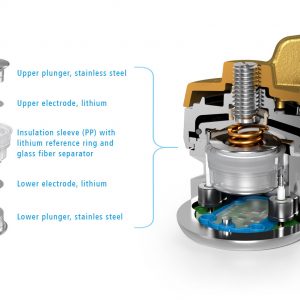
Lithium metal is an obvious candidate, although it is not at all contained in a real lithium-ion battery. However, lithium metal is a component of the half-cells that are often built in LiB research laboratories. Therefore, and for the sake of simplicity, we will start using lithium metal for all three electrodes of the PAT-Cell: the two main electrodes (marked 1 and 2 in the sketch below) and also the ring-shaped electrode at the separator edge (marked R). Granted, this is not a battery, but it’s a good starting point.
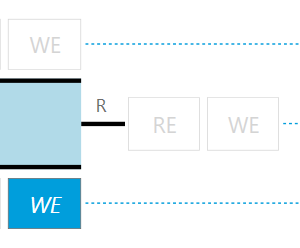
Figure 1b: Sketch showing the connection between PGStat and PAT-Cell (EL-Software Connection Matrix).
Let us briefly look at the connection between PAT-Cell and the potentiostat /galvanostat (PGStat). As a special feature of the PAT-Tester, this connection can be changed during the experiment runtime by a simple command in the test script.
Watch the video to learn more about the Connection Matrix:
For the present experiment, we will move lithium ions with a constant current of 2 mA from electrode 1 to electrode 2 for about 3.5 hours, then reverse the direction of the current and move the lithium ions in the opposite direction for another 3.5 hours. This cycle is repeated once. Intermittently, during the whole test, a small sinusoidal current was superimposed on the dc current, at frequencies between 62 kHz and 10 Hz, in order to measure the impedance.
We made a few short videos that illustrate the work with the PAT system and with EL-Software. Here you go:
Video 2: Building the PAT-Cell:
Video 3:Writing the test procedure in EL-Software:
Video 4: Running the experiment in EL-Software:
After 2 cycles and 16 hours the experiment was stopped and the gathered data were imported into and plotted with OriginLab™.
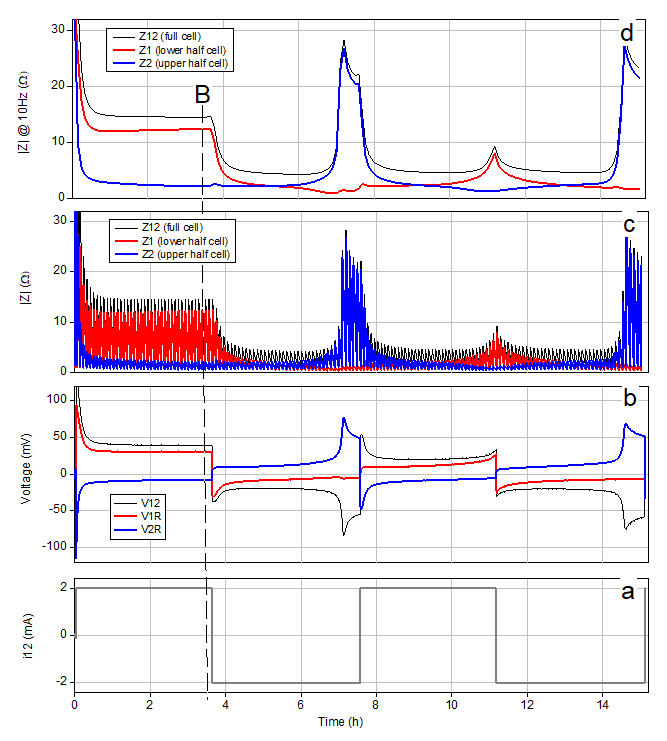
The diagrams in figure 2 show from bottom to top the applied direct current i12 (the alternating current contribution for the EIS measurement is hidden), the voltages (V12, V1R, V2R) and the impedances (magnitudes of Z12, Z1, Z2) of the full cell and the two individual electrodes.
Every 5 minutes a small sinusoidal current in the frequency range from 62 kHz to 10 Hz was superimposed on the applied direct current. This intermittent GEIS technique (galvanostatic electrochemical impedance spectroscopy) results in the up and down of the |Z| curves when plotted against the experiment time (Fig. 2 c). To facilitate interpretation, we have also plotted the impedance values at a fixed frequency of 10 Hz (Fig. 2 d).
Fig. 2 shows just a subset of the many data acquired during the experiment. Especially, there is much more information available about the frequency dependence of the impedance. As only one example, Fig. 3 shows two impedance spectra for each half cell. The first spectra were measured 5 minutes after starting the experiment (label A). The second spectra (B) were measured at the end of the first half cycle. As a common feature all Nyquist spectra share a semicircle whose diameter can be interpreted as the charge transfer resistance of the SEI.
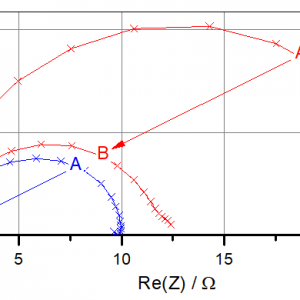
Figure 3: Single electrode impedance spectra 5 minutes after starting the cycle (A) and at the end of the first half cycle (B). Lithium is getting plated on electrode 2. For details, see text.
What do we observe (and what do we speculate)?
By applying a positive current i12, lithium metal is getting dissolved (stripped) at electrode 1 and deposited (plated) at electrode 2. This way, fresh lithium surface is continuously created on both sides, and immediately covered by the decomposition products of the spontaneous reaction with the electrolyte solution: The famous solid electrolyte interphase (SEI) is being formed as the bottleneck for charge transfer. One could believe that this Li|Li cell behaves completely symmetrically. The opposite is true: The surface morphologies of the two electrodes develop in very different ways. At electrode 1 the metal dissolution leaves a rather smooth surface behind. In contrast, at electrode 2, new metal is deposited as a dendritic, porous layer with continuously increasing surface area. This difference in surface area (and therefore in “real” current density) is clearly reflected in the over-voltages of the two electrodes. During the first minutes of the experiment, both |V1R| and |V2R| decrease in a similar way. During this initial period the “as-received” passivation layer on the metal surface probably transforms into the SEI-type passivation layer determined by the chemical species in the electrolyte. However, as time goes by, the over-voltages get more and more determined by the very different evolution of the electrode porosity. Consequently, the overvoltage at electrode 1, which remains smooth, settles at a much higher value than the overvoltage at electrode 2, which becomes more and more porous.
When the current direction is changed after 3.5 hours, the previously formed porous metal layer on electrode 2 begins to dissolve again, while dendritic lithium starts to deposit on the previously smooth metal surface of electrode 1. Again, the observed over-voltages mainly reflect the different porosities (“real” surface areas), while the SEI layers, which are formed on the fresh metal surface by spontaneous chemical reduction of the electrolyte solution, are supposed to be similar on a microscopic scale. The renewed rise of V2R at the end of the second half cycle fits well into the above picture: At this stage the dendritic lithium on electrode 2 is almost completely depleted, so that non-porous lithium must be dissolved again.
From the perspective of the experimenter, a clear advantage of a lithium metal electrode over a Li-ion battery electrode (such as NCM or graphite) is that its equilibrium potential is always constant and known, almost exactly 0 V against Li/Li+. Thanks to this fact, the measured electrode potential is equal to the over-voltage (in magnitude) and scales, at constant current, with the charge transfer resistance of the respective electrode. This relation can be clearly observed in the evolution of the electrode impedances.
How can we get more evidence?
When dismantling the PAT-Cell after the experiment, one can clearly see a greyish residue of dendritic lithium in the separator and on the surface of the two lithium electrodes.
Video 5: Disassembling the PAT-Cell
An even more direct way is to observe dendrite growth through a window in the test cell. The ECC-Opto-Std is the perfect test cell for this purpose. Here you go!
Video 6: ECC-Opto-Std – Watch lithium dendrites grow
Unfortunately, the time lapse video stops before the first cycle is completed. But even this short period of time is enough to realize that many dendrites lose contact to their “mother” electrode and must be considered lost for the rest of the experiment.
What can we conclude?
Bad news is that during plating / stripping of lithium metal some of the precious metal is lost due to the chemical reaction with the electrolyte solution and, what is even worse, some dendrites can find their way to the counter electrode and cause a short circuit. This is the sad truth about the lithium metal electrode and even today prevents its use in rechargeable batteries.
Another piece of bad news is that the lithium metal electrode behaves very differently at rest, during stripping and plating, and that its impedance depends heavily on the history of the experiment. This fact makes lithium a difficult electrode to study anode and cathode materials in two-electrode half cells. We will demonstrate this in our next application report, which will focus on the cathode half cell: NCM versus Lithium – Too much Lithium?
I should also remember the good news. The good news is that there is plenty of room for new inventions around a reversible lithium metal electrode and that the PAT system is the perfect tool for such inventions. Enough material for many more application notes. Please stay tuned!
—
by Dr. Matthias Hahn, Dr. Annika Baumann, Margaryta Paramonova, Daniel Wilke



Comments are closed.